See the food safety risk on every material before it reaches your test plan.
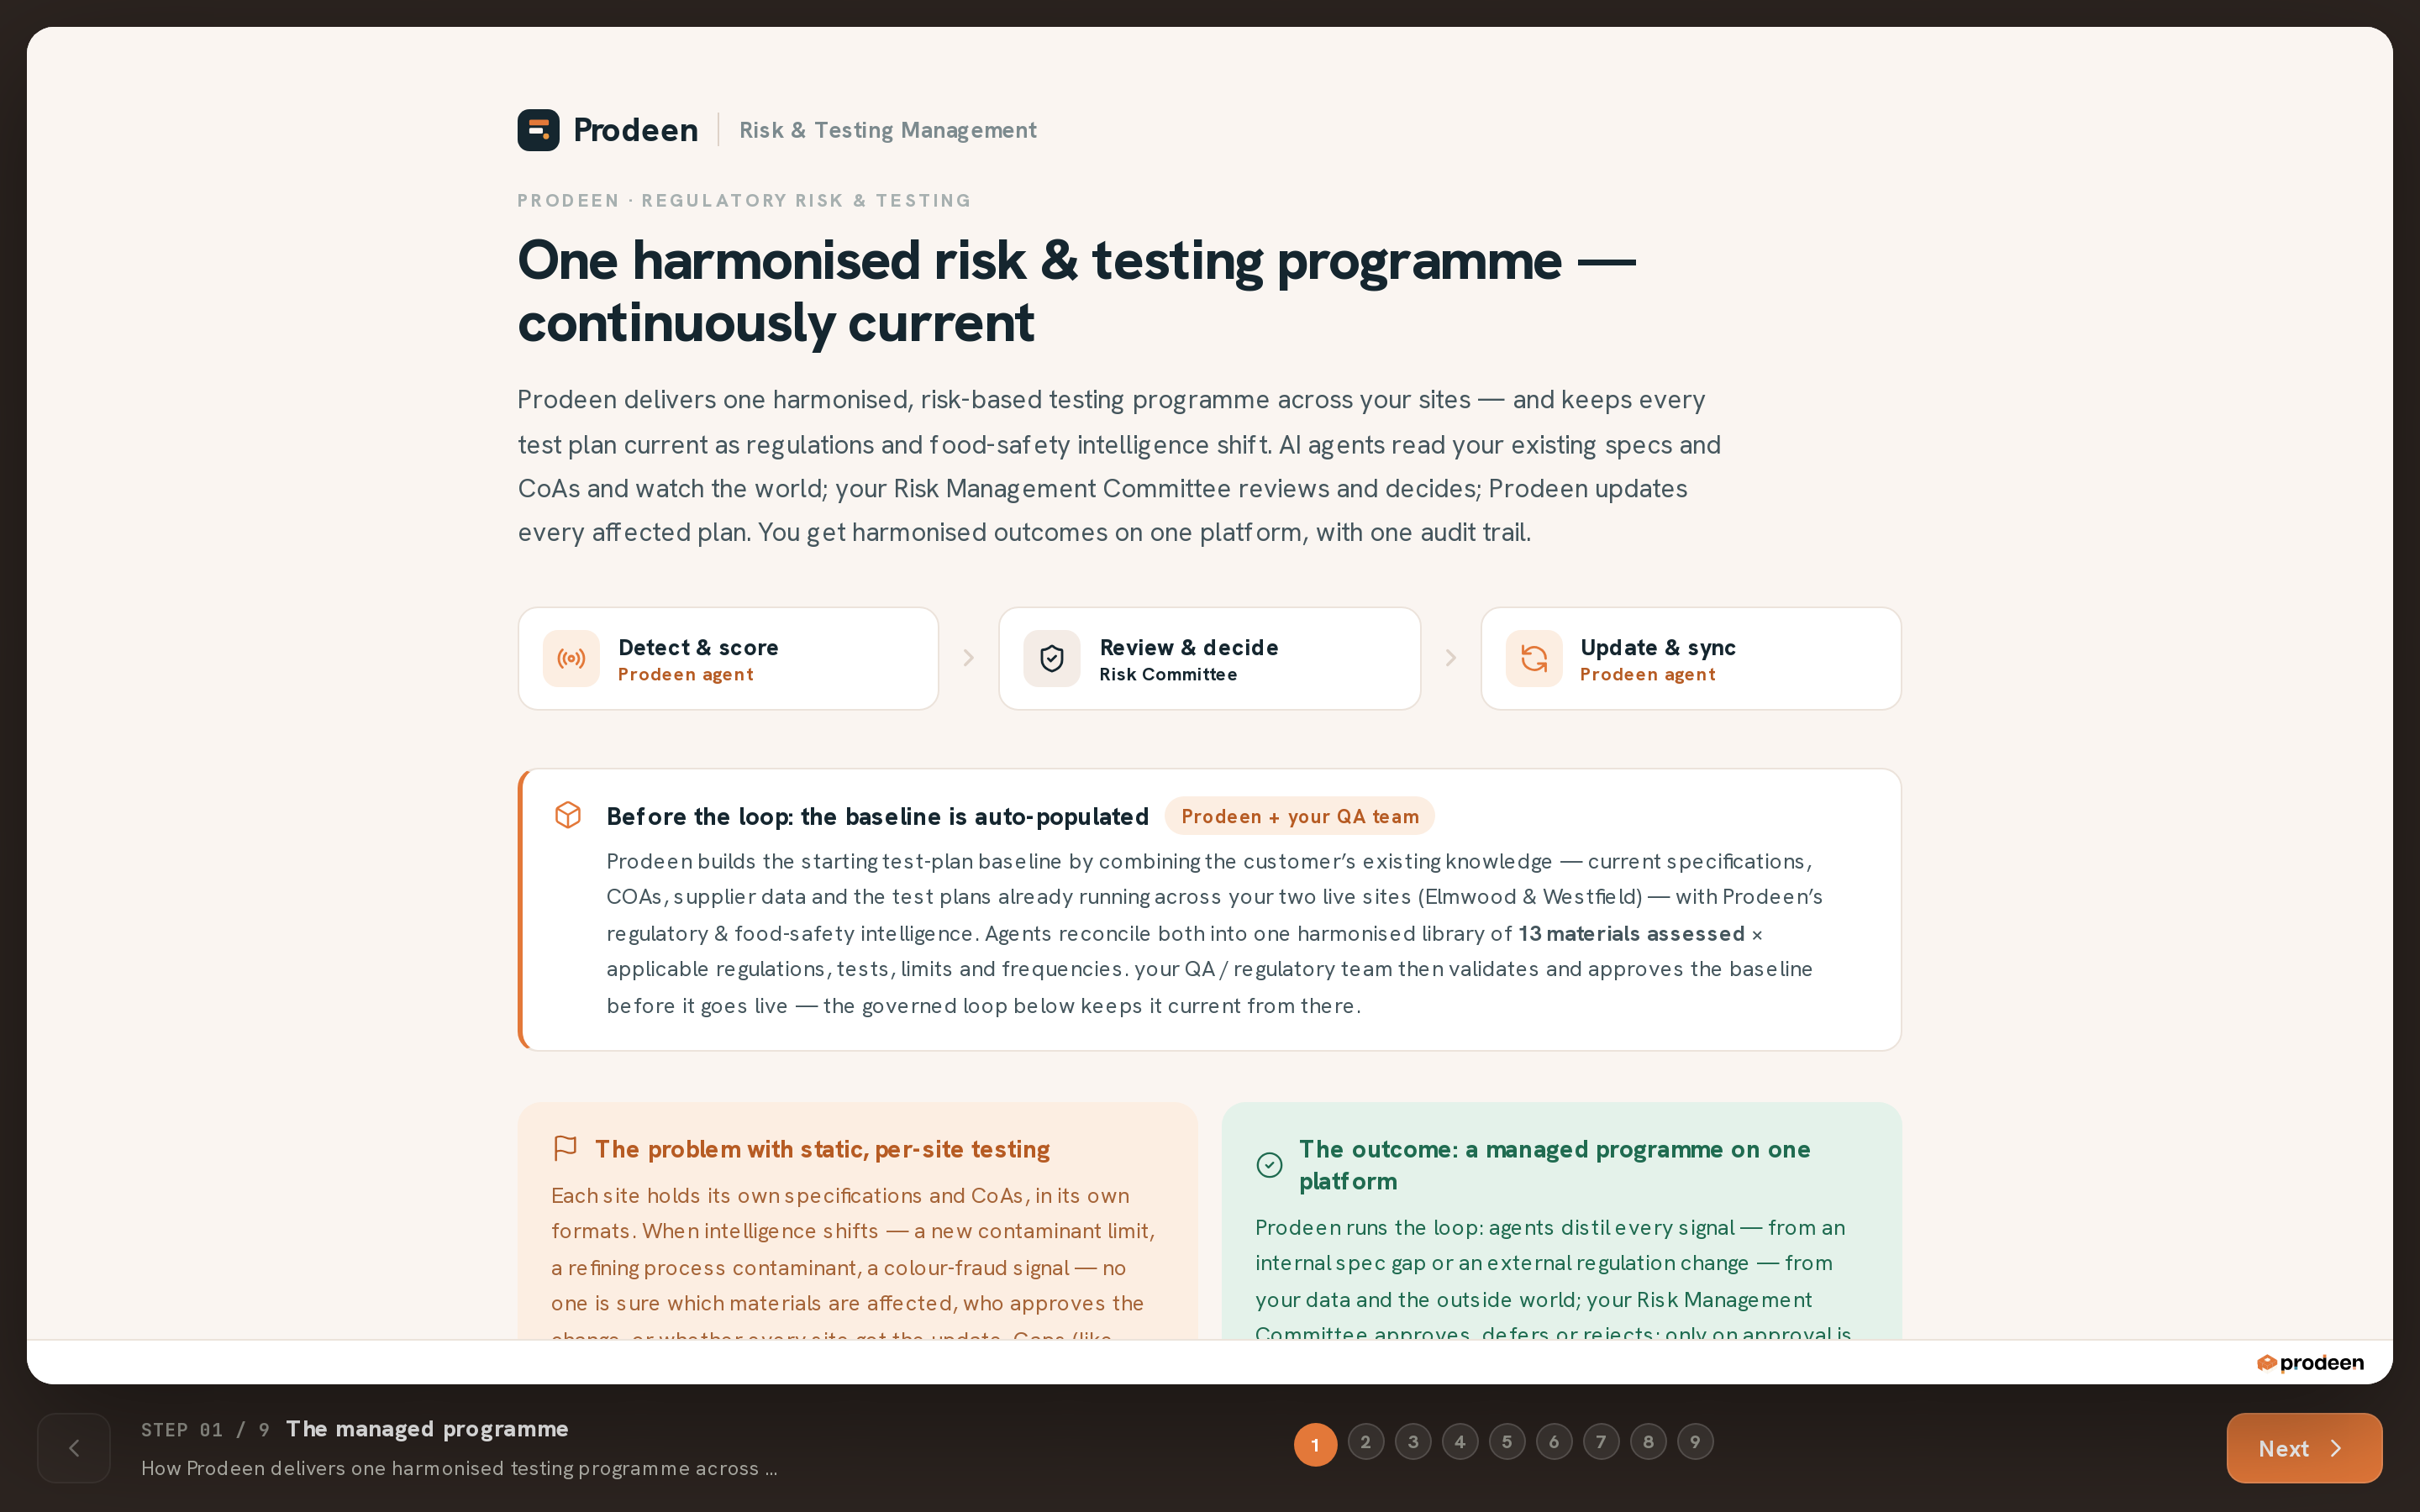
Prodeen watches incidents, science, press, regulation and your supply chain for the hazards in your categories, scores each risk, and proposes the change to your test plan with its cost. Your experts decide.
A testing programme set once a year misses the risks that move
Plans are written from the specification and the last audit, then left for a year. Hazards move faster than that.
Hazards nobody screens
A refined oil specification with no limit for 3-MCPD or glycidyl esters, both with EU maximum levels.
The same material tested three times
One site over-tests a material while another misses a parameter, because no one sees the plans side by side.
Changes tracked by email
A new maximum level reaches the plan months after its application date, if at all.
What the risk radar watches
The radar covers any ingredient category and any hazard, organised by category because that is how risk travels: from one origin and matrix to every product made from it.
Lanes
Official notifications every day; science, press and regulation in every market you sell to, every week. Harvest reports and price moves count too.
Stations
A risk sits at one of five stations, from weak signal to regulated. The first two buy you time.
Score
A score out of 100 from incident momentum, novelty, scientific signal, public attention and control gap. A component without data says so.
How a risk becomes a change to your plan
Every signal is read against your plan. The event names the rows it touches and proposes one change with its cost: a frequency up or down, a new parameter, a new limit. Your committee decides, and the change reaches every site that uses the material.
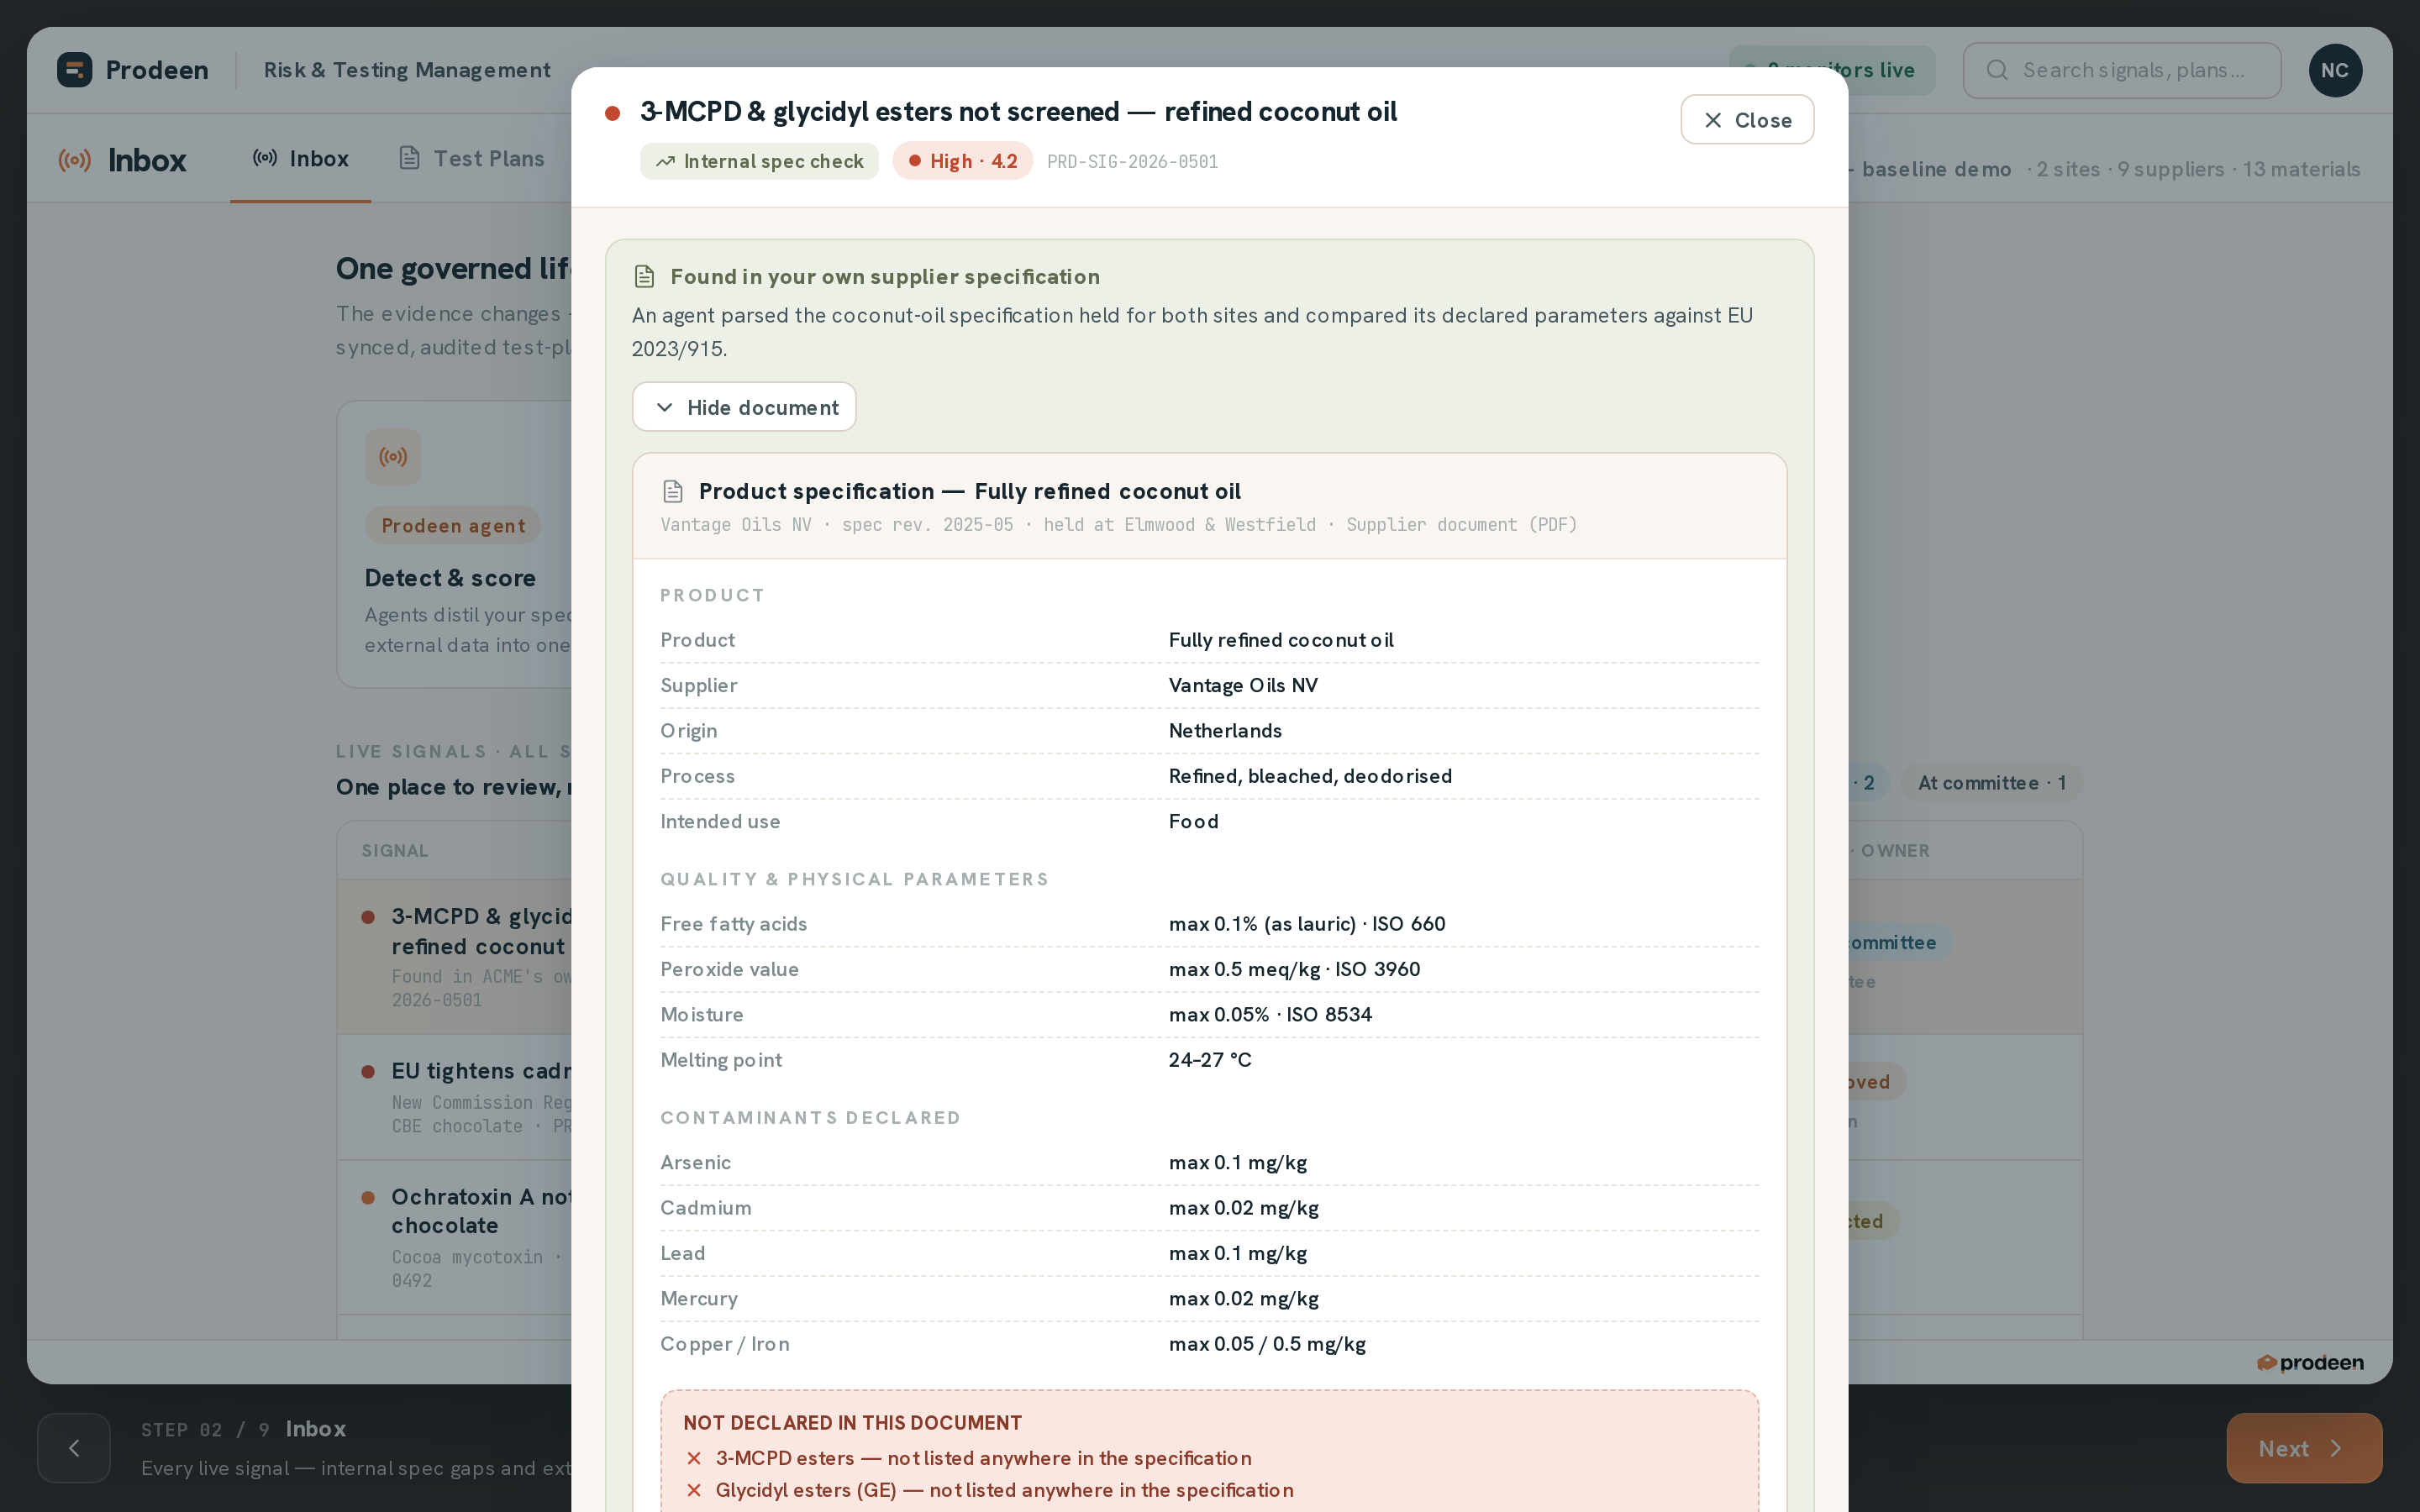
A supplier specification with rows missing
The event opens the document, shows the gap and proposes the rows with a method and a price.
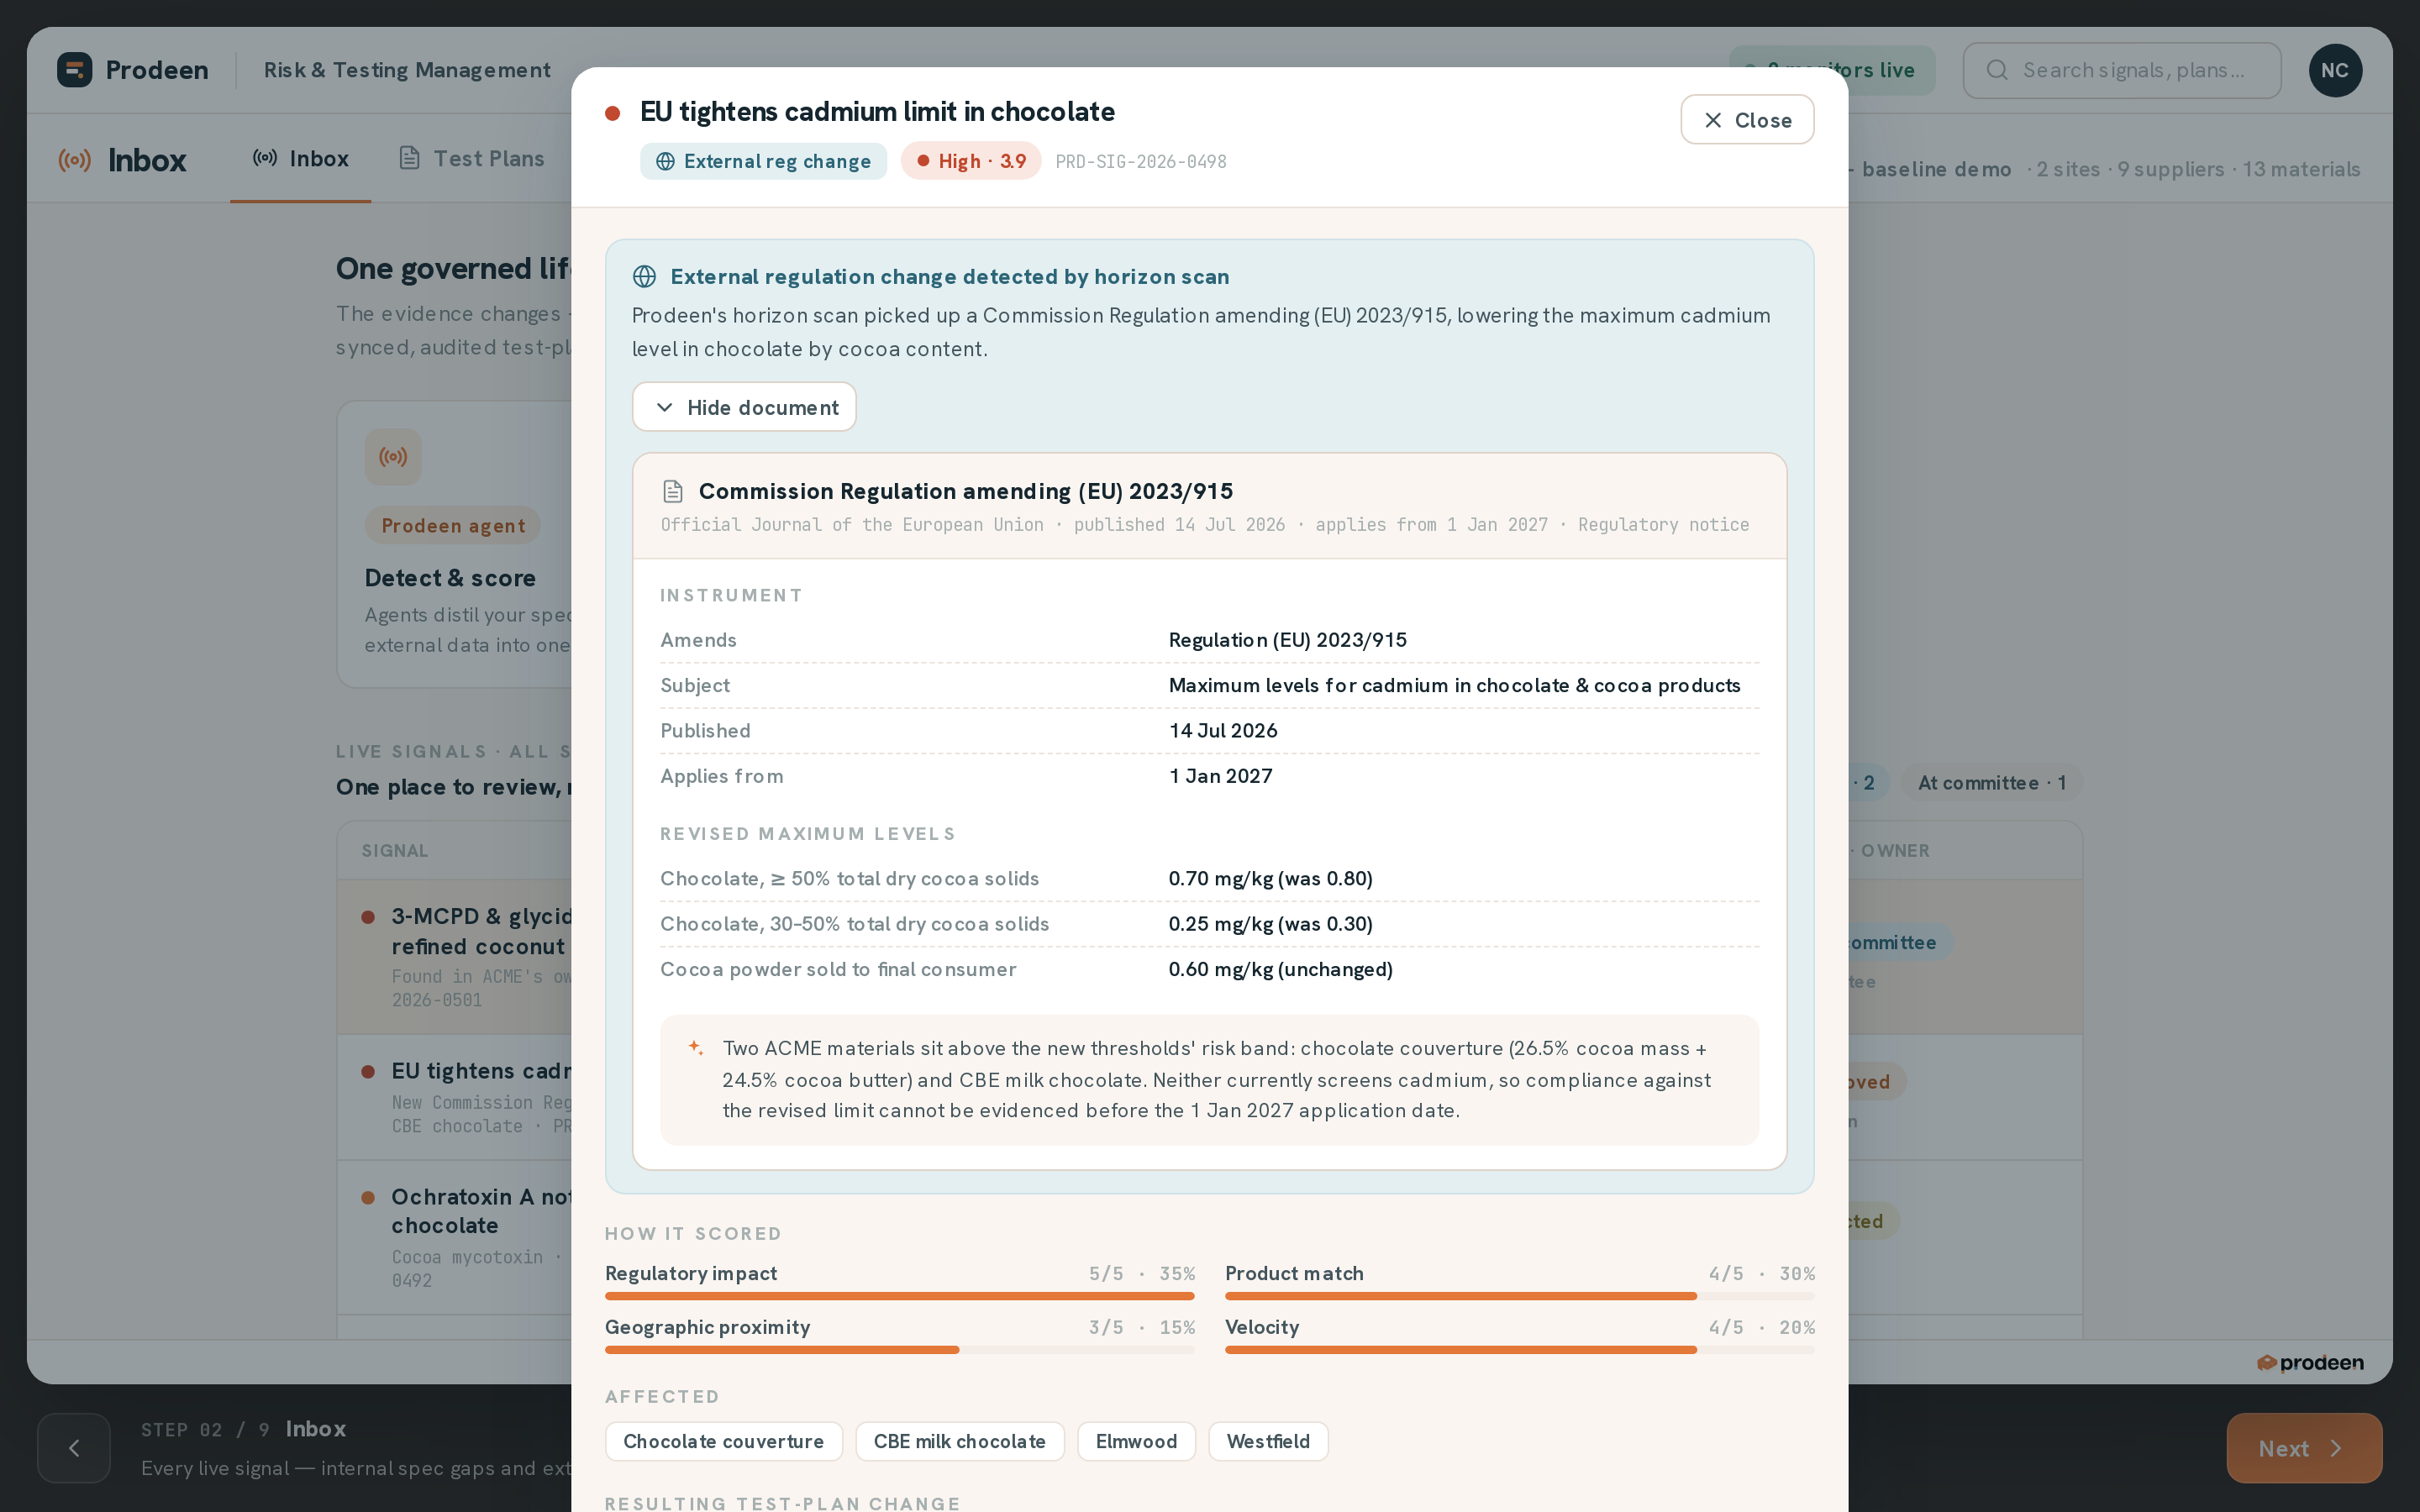
A regulation lowers a limit
The event maps it to the affected materials and drafts the plan change before the application date.
Worked example: black pepper at one spice processor
An illustrative processor buys 6,000 tonnes a year from three origins. Its plan has ten rows, each with a frequency per origin and a cost per year.
Eight clean lots step a row down; one high result steps it back up; every uplift carries a review date.
One quarter, three proposals.
A price rise on the main origin lifted the fraud score: adulteration screen on every lot from new suppliers, costed.
AcceptedAn ethylene oxide notification on one origin: every-lot screening there until five clean lots, priced.
AcceptedEight clean lots from one supplier: the pesticide residue row qualifies for a step down, saving costed.
Waiting for the committeeIllustrative processor, plan and events; no event refers to a company.
Dynamic test plans: the programme as data
One row per material and hazard, so every proposal shows its price before anyone approves it.
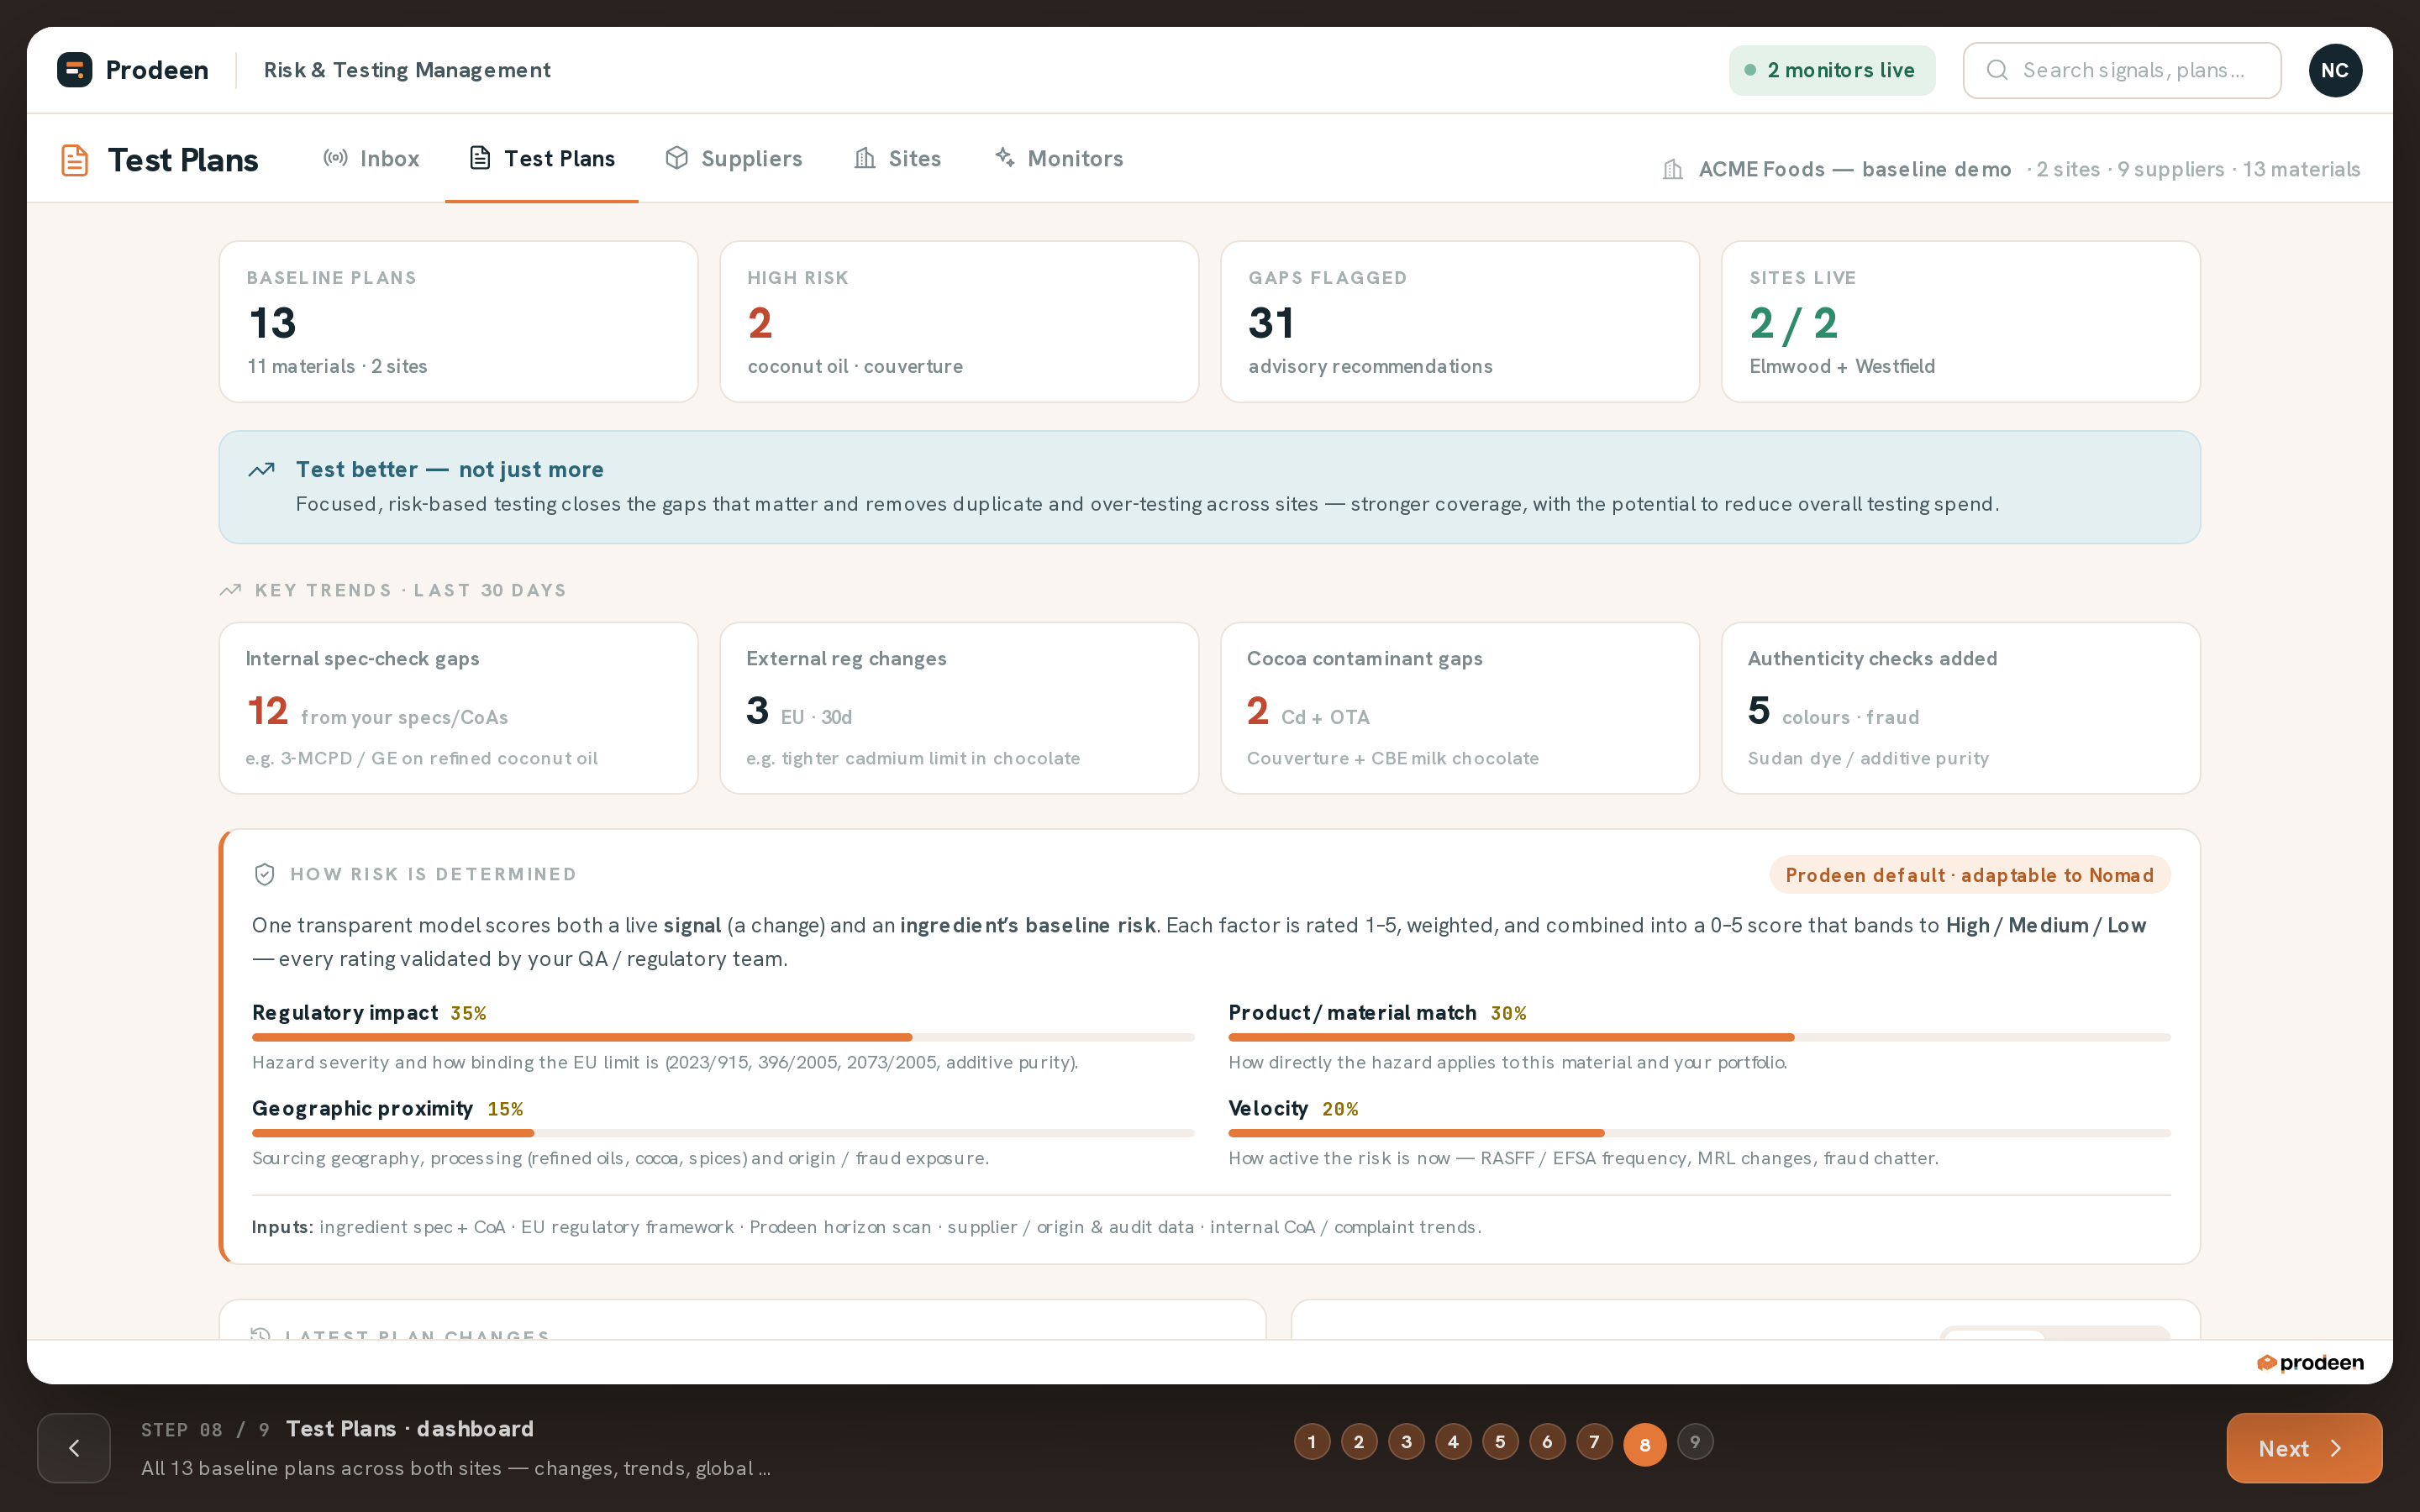
Full test plans
Parameters, methods, limits, frequencies and version history.
Category specifications
One baseline per category, with modifiers for origin and volume.
Inbox
Every risk and proposed change in one place, with its source.
Suppliers
A scorecard per supplier from CoAs, audits and open risks.
Sites
Every site and material, down to the plan row.
Connections
LIMS, SAP QM or your specification system, through API or MCP.
Large manufacturers
Large manufacturers run it with their own experts: a paid Build, then a Sustain subscription, scope by scope.
Smaller producers
Smaller producers buy the outcome from an expert firm or a testing laboratory that runs on the same platform.
Every score shows its inputs
Your specifications and CoAs, regulation in every market you sell to, incident feeds, the scientific literature, supplier and audit data, and your own test history. Every component shows the rows behind it.
“Prodeen surfaced a real contaminant gap in our own supplier data that we hadn’t been screening for.”